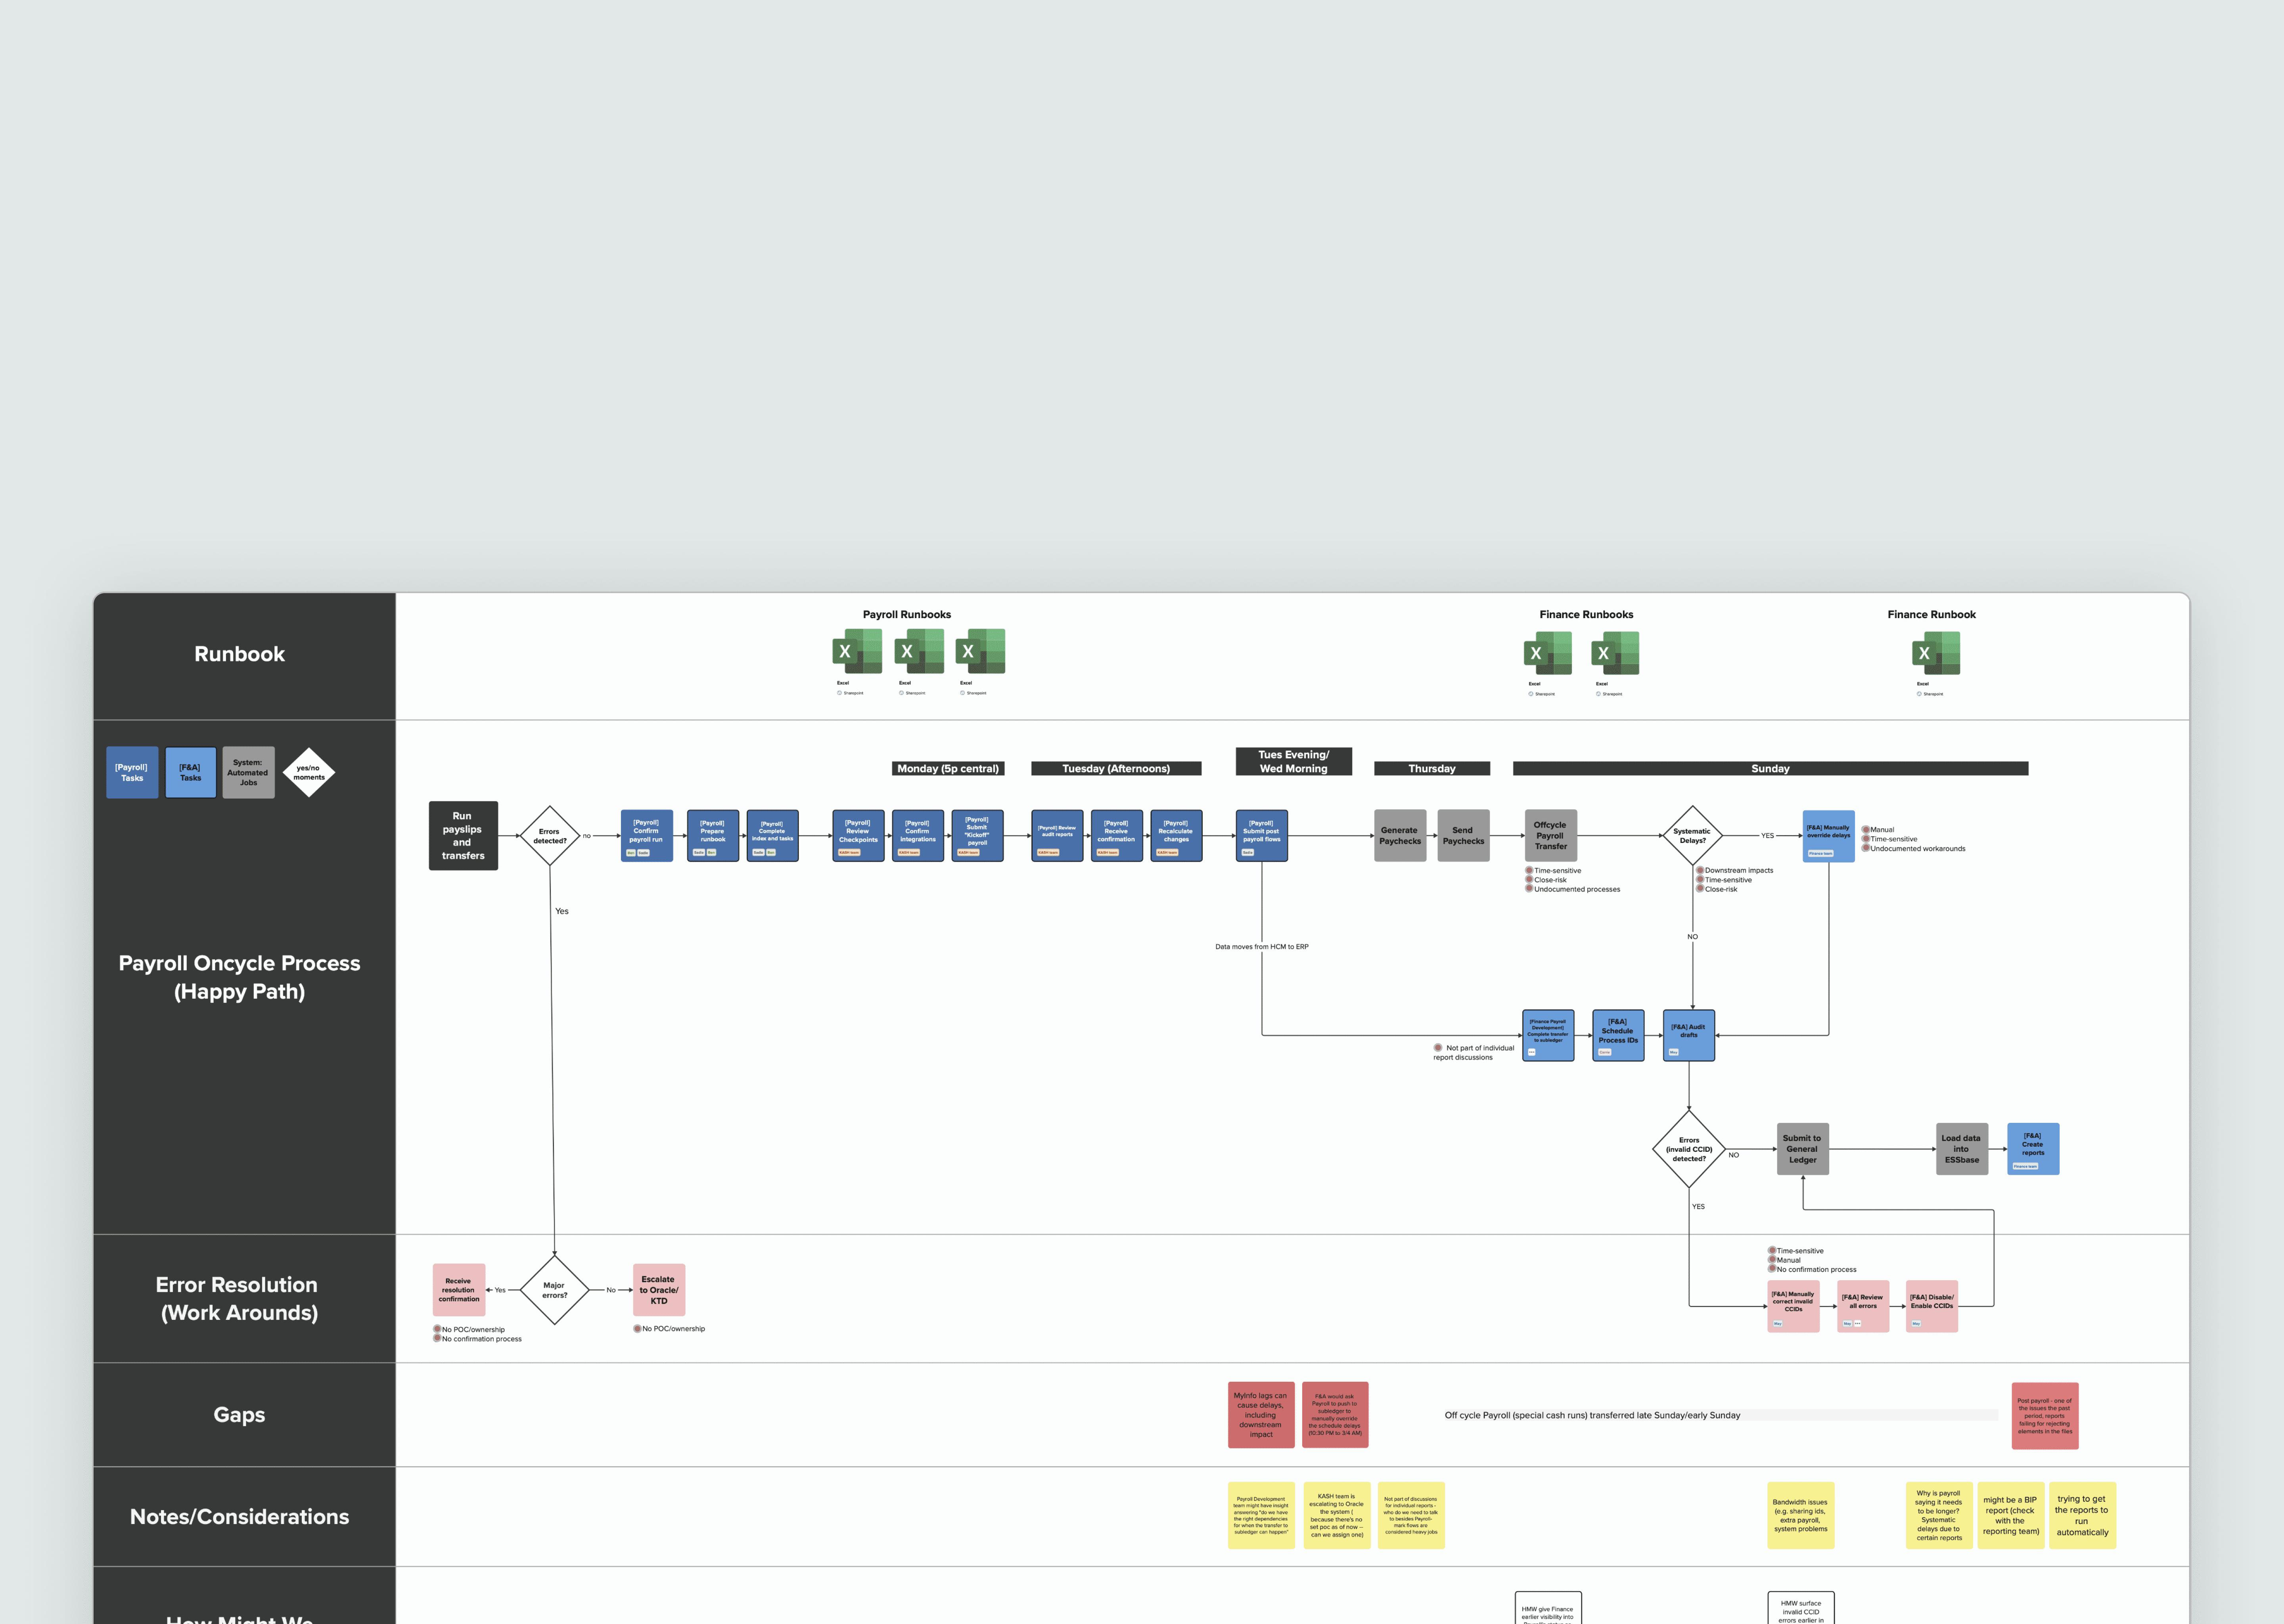
Where the system broke
Each consumer data team who keep Kroger's sales data flowing are accountable for data failures they have no way to see coming. The monitoring that could warn them already exists but locked to the consumer teams. The upstream changes causing failures go unannounced, turning preventable issues into rework, untrusted decisions, and financial-reporting risk.
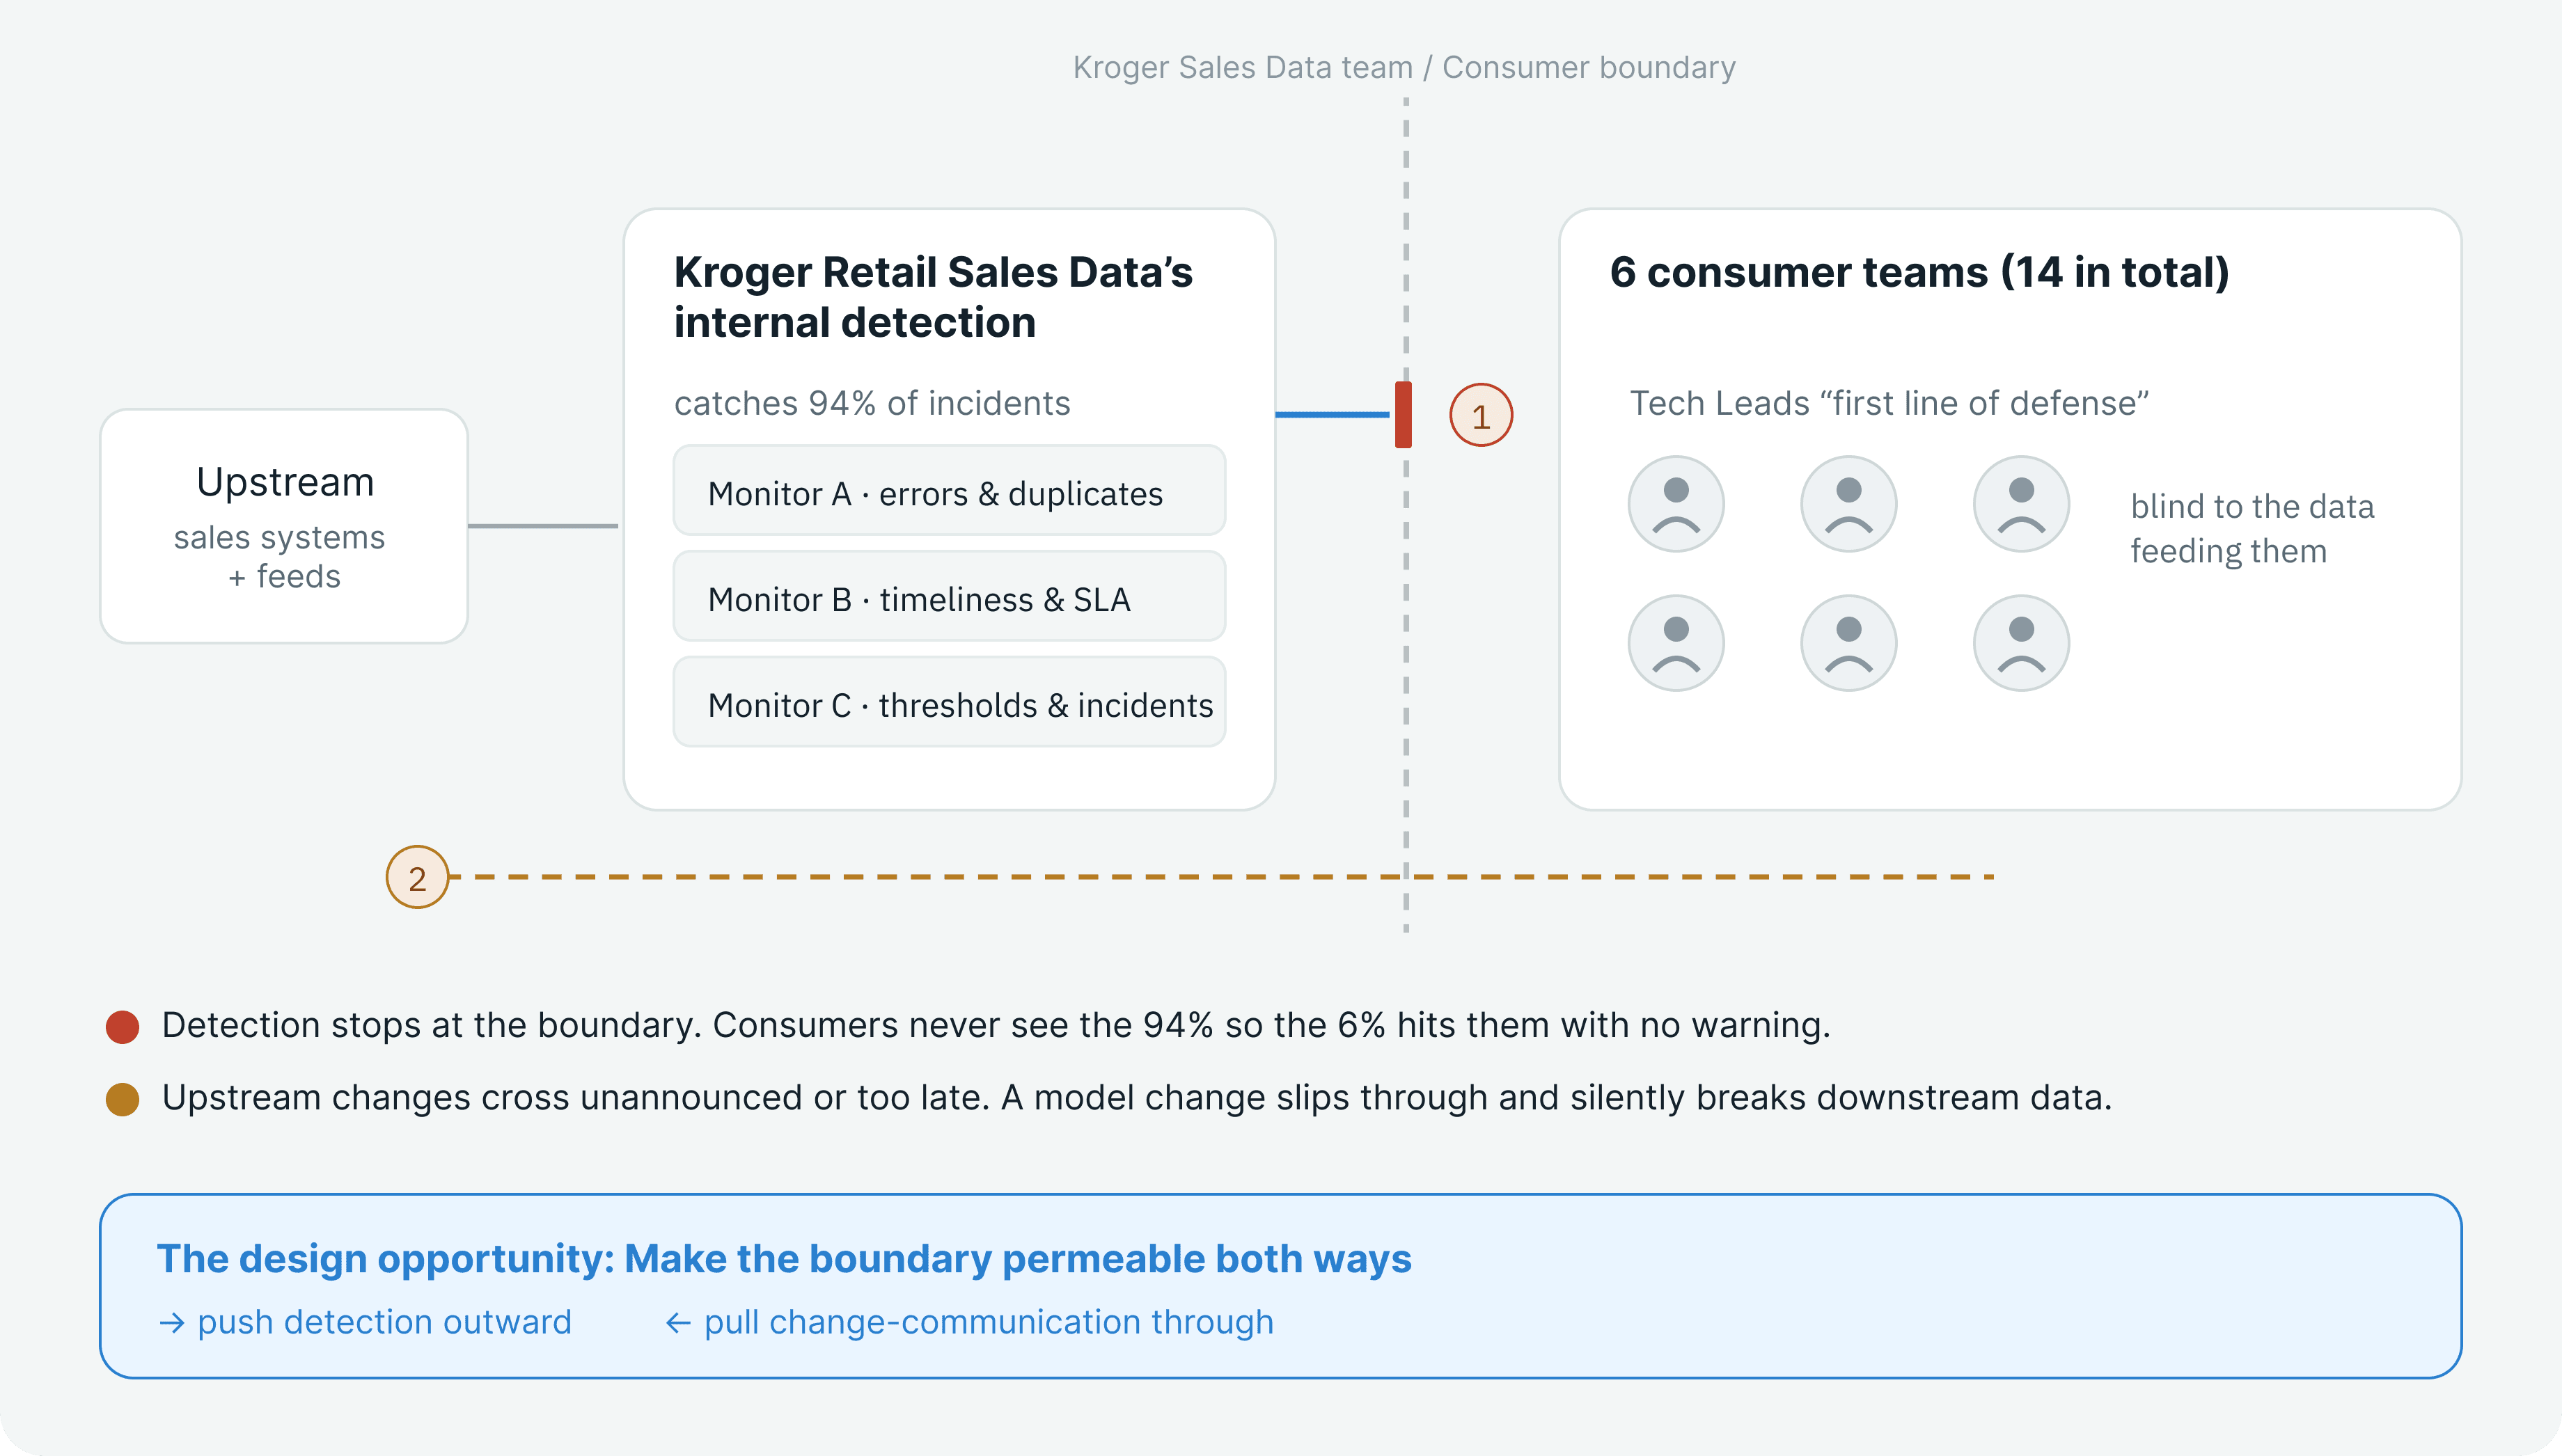
Our goal
Adopt a data health monitoring strategy to serve the consumer teams and pair visibility and data resolution with communication to reduce reactive incident (6% of tickets for incorrect and missing data).
What I owned
Problem definition · system model · product strategy and roadmap · dashboard IA and the notification/communication system · prioritization · lo-fi - hi-fi prototypes. Led a 3-person research team.

Identifying what and who we're solving for
Recalibrating the team's direction, I expected to design monitoring for the product managers but our user interviews with six of the consumer teams revealed three primary findings that would define and size the brief going forward:
Proving where the org should invest
Because design's involvement on this domain wasn't a given, and neither was a consumer-facing solution, our hypothesis-driven research ultimately proved the org should invest in design to build a monitoring + communication system for a total of fourteen data consumer teams.
User Interviews
“If checks were published somewhere where we could see them. So we can know about it before we find out for ourselves.
I anchored on the KPI leadership already owned, proactive incident identification, and let our users' own words explicitly carry the need for a monitoring platform.
Participant 2, 3
Initial ideation with cross-functional de-risking
After feature alignment from user stories and pain points, our team (3 PMs, 5 data architects, 2 PDs) brainstormed solution directions and further de-risked technical feasibility into possible-solutions comparison and object/system models.

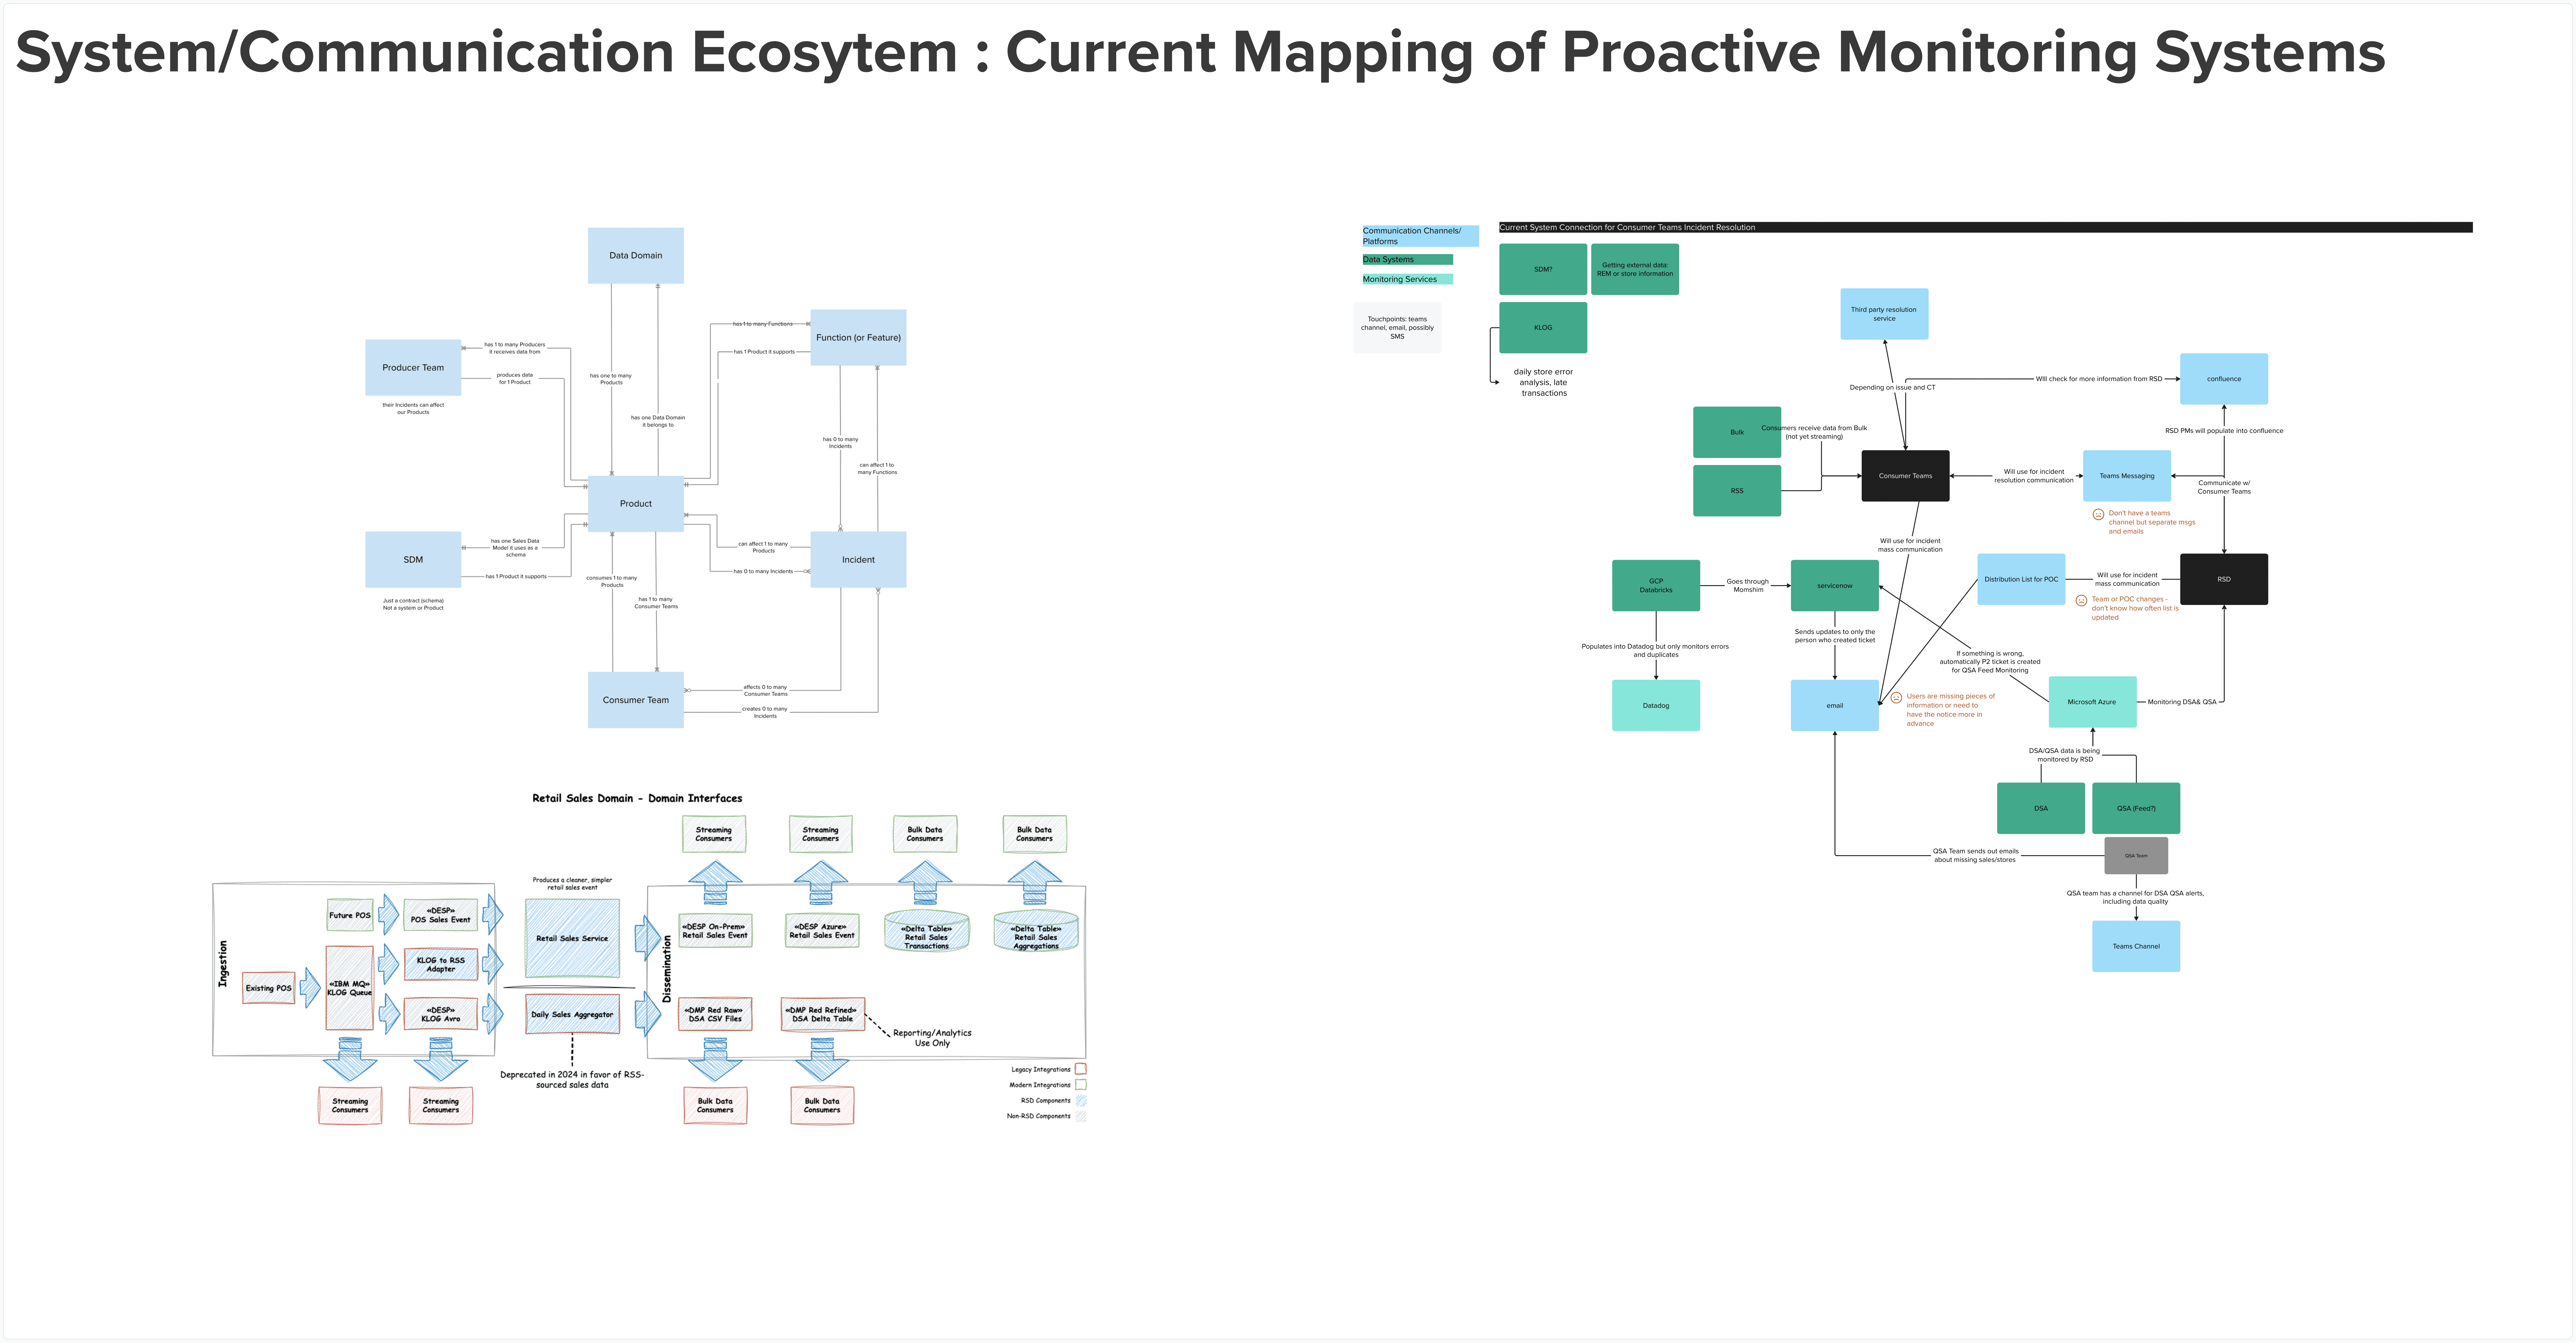
Ultimately our team decided on a hosted platform solution build instead of a custom dashboard web app design.
Pivoting to a custom web app design
Using hosted platforms lose what our research proved matters most: the communication layer and trust cues. Our team redirected ideation to a custom build.
Building our prioritization system, the backbone of our roadmap
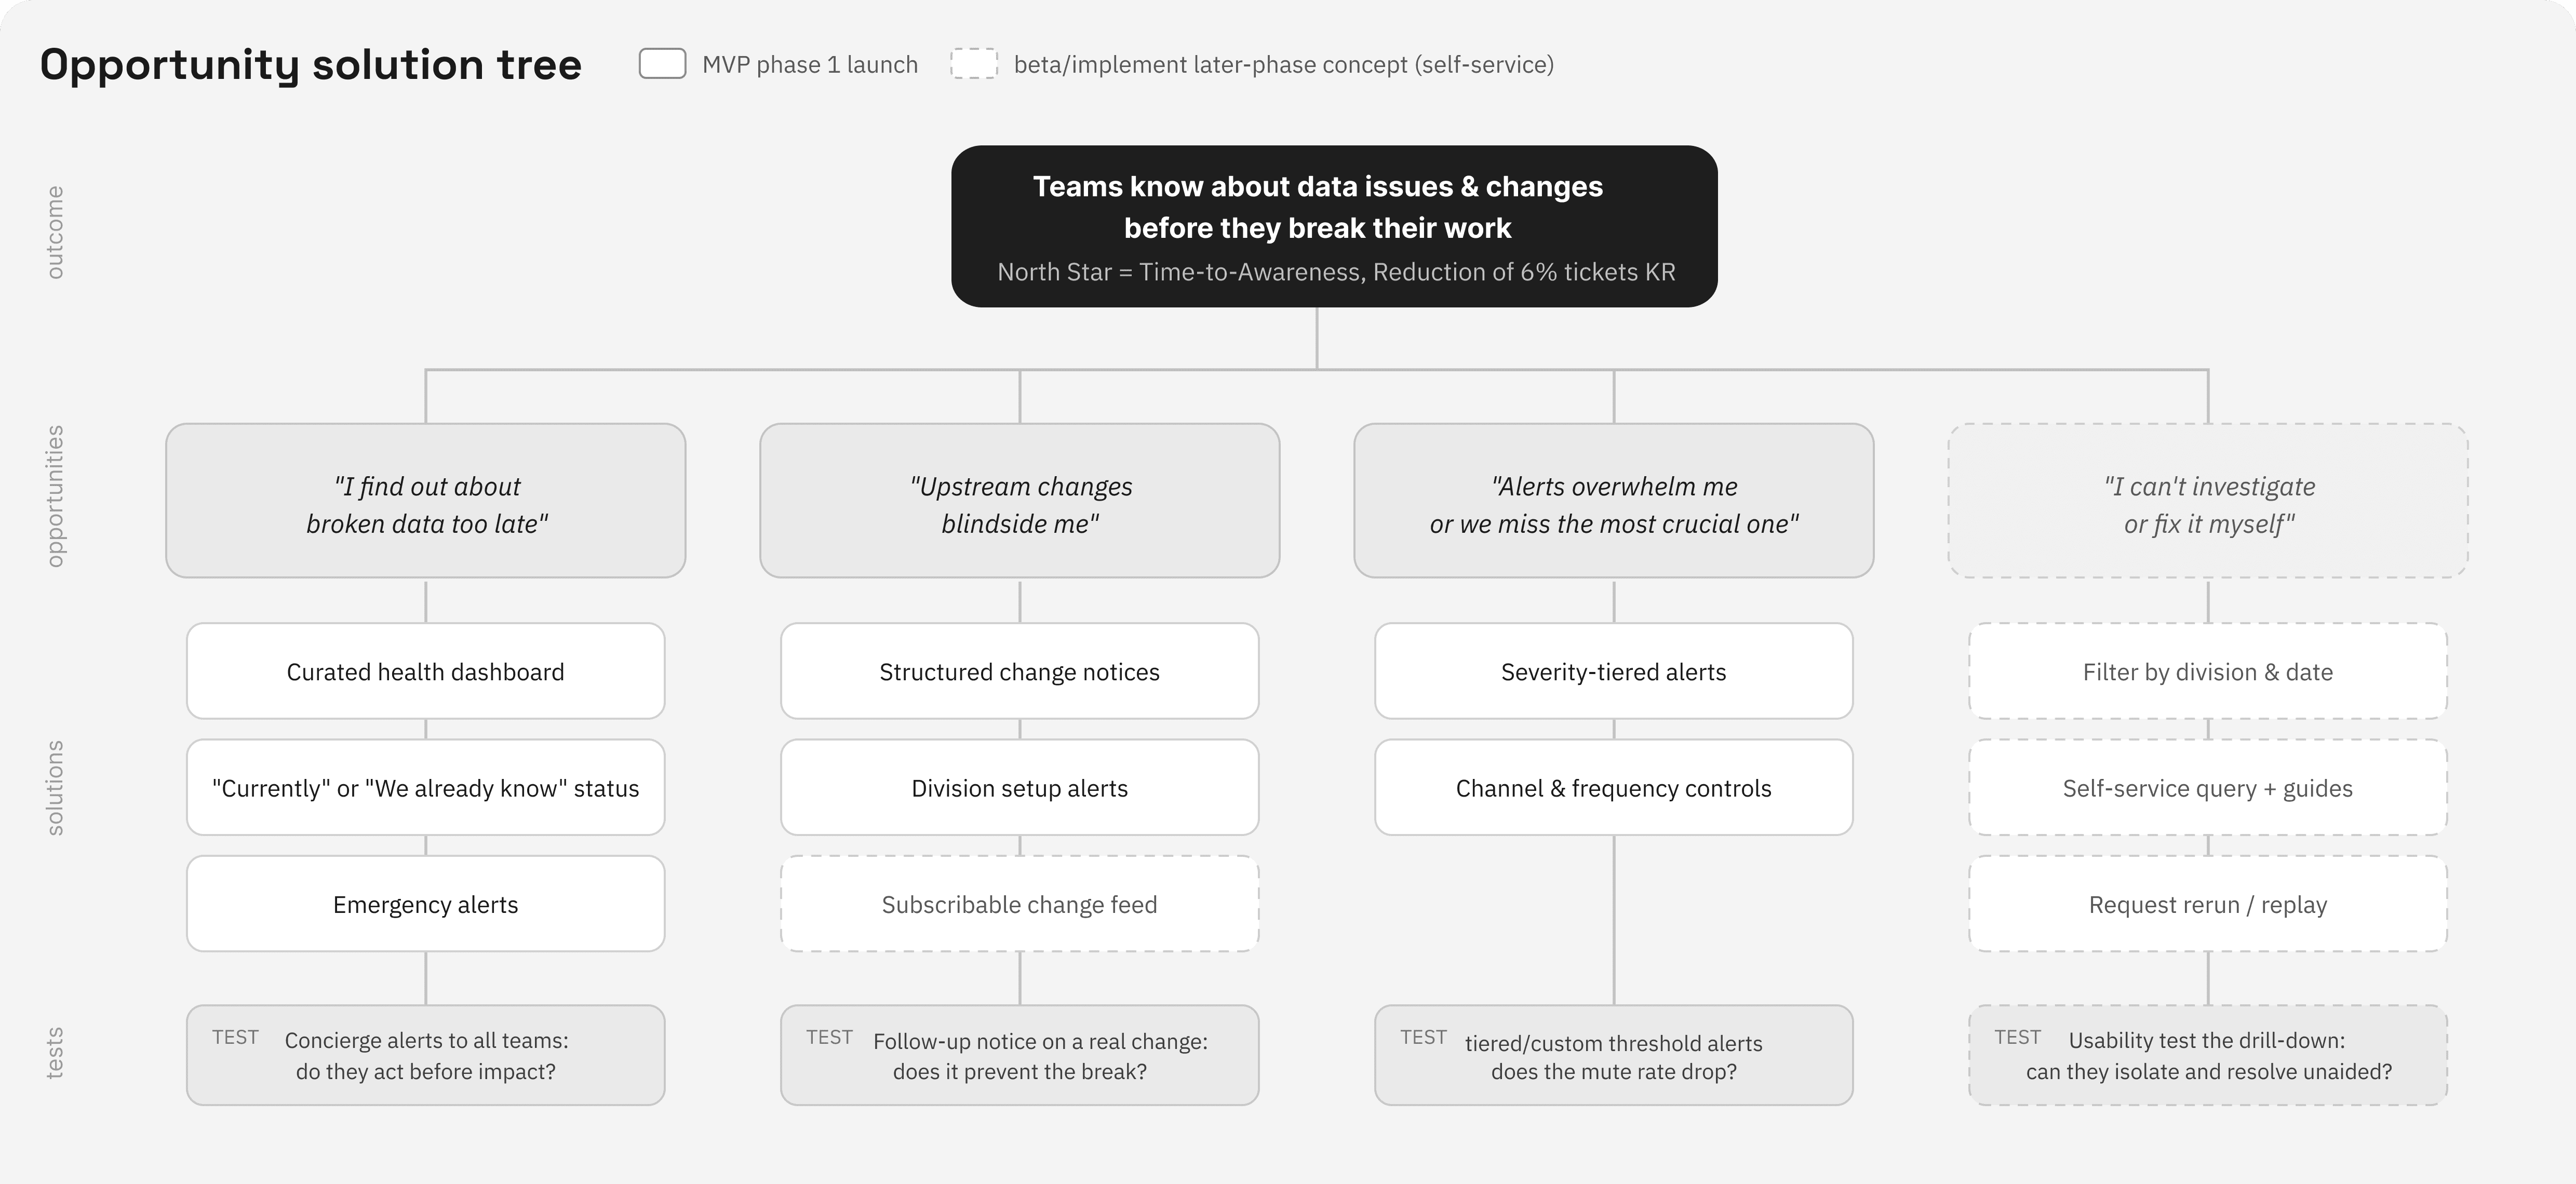
With unexpected team and technical system changes, I proposed to move forward with an opportunity solution tree, mapping every feature back to the outcome (reduce time-to-awareness). This built the prioritization system, the backbone of our now/next/later roadmap.
Back to the drawing board
Without the pre-built data and design constraints, we had usability and creative freedom to focus on not just what users need to see but how they want to be communicated.
Iteration 01 — Adding direct visibility to Alerts
Alerts were hidden at the top right of the Main Overview. They wanted to see what's under review, adjust notification preferences and act on any breakages in one view, weighing importance for data and communication visibility the same.


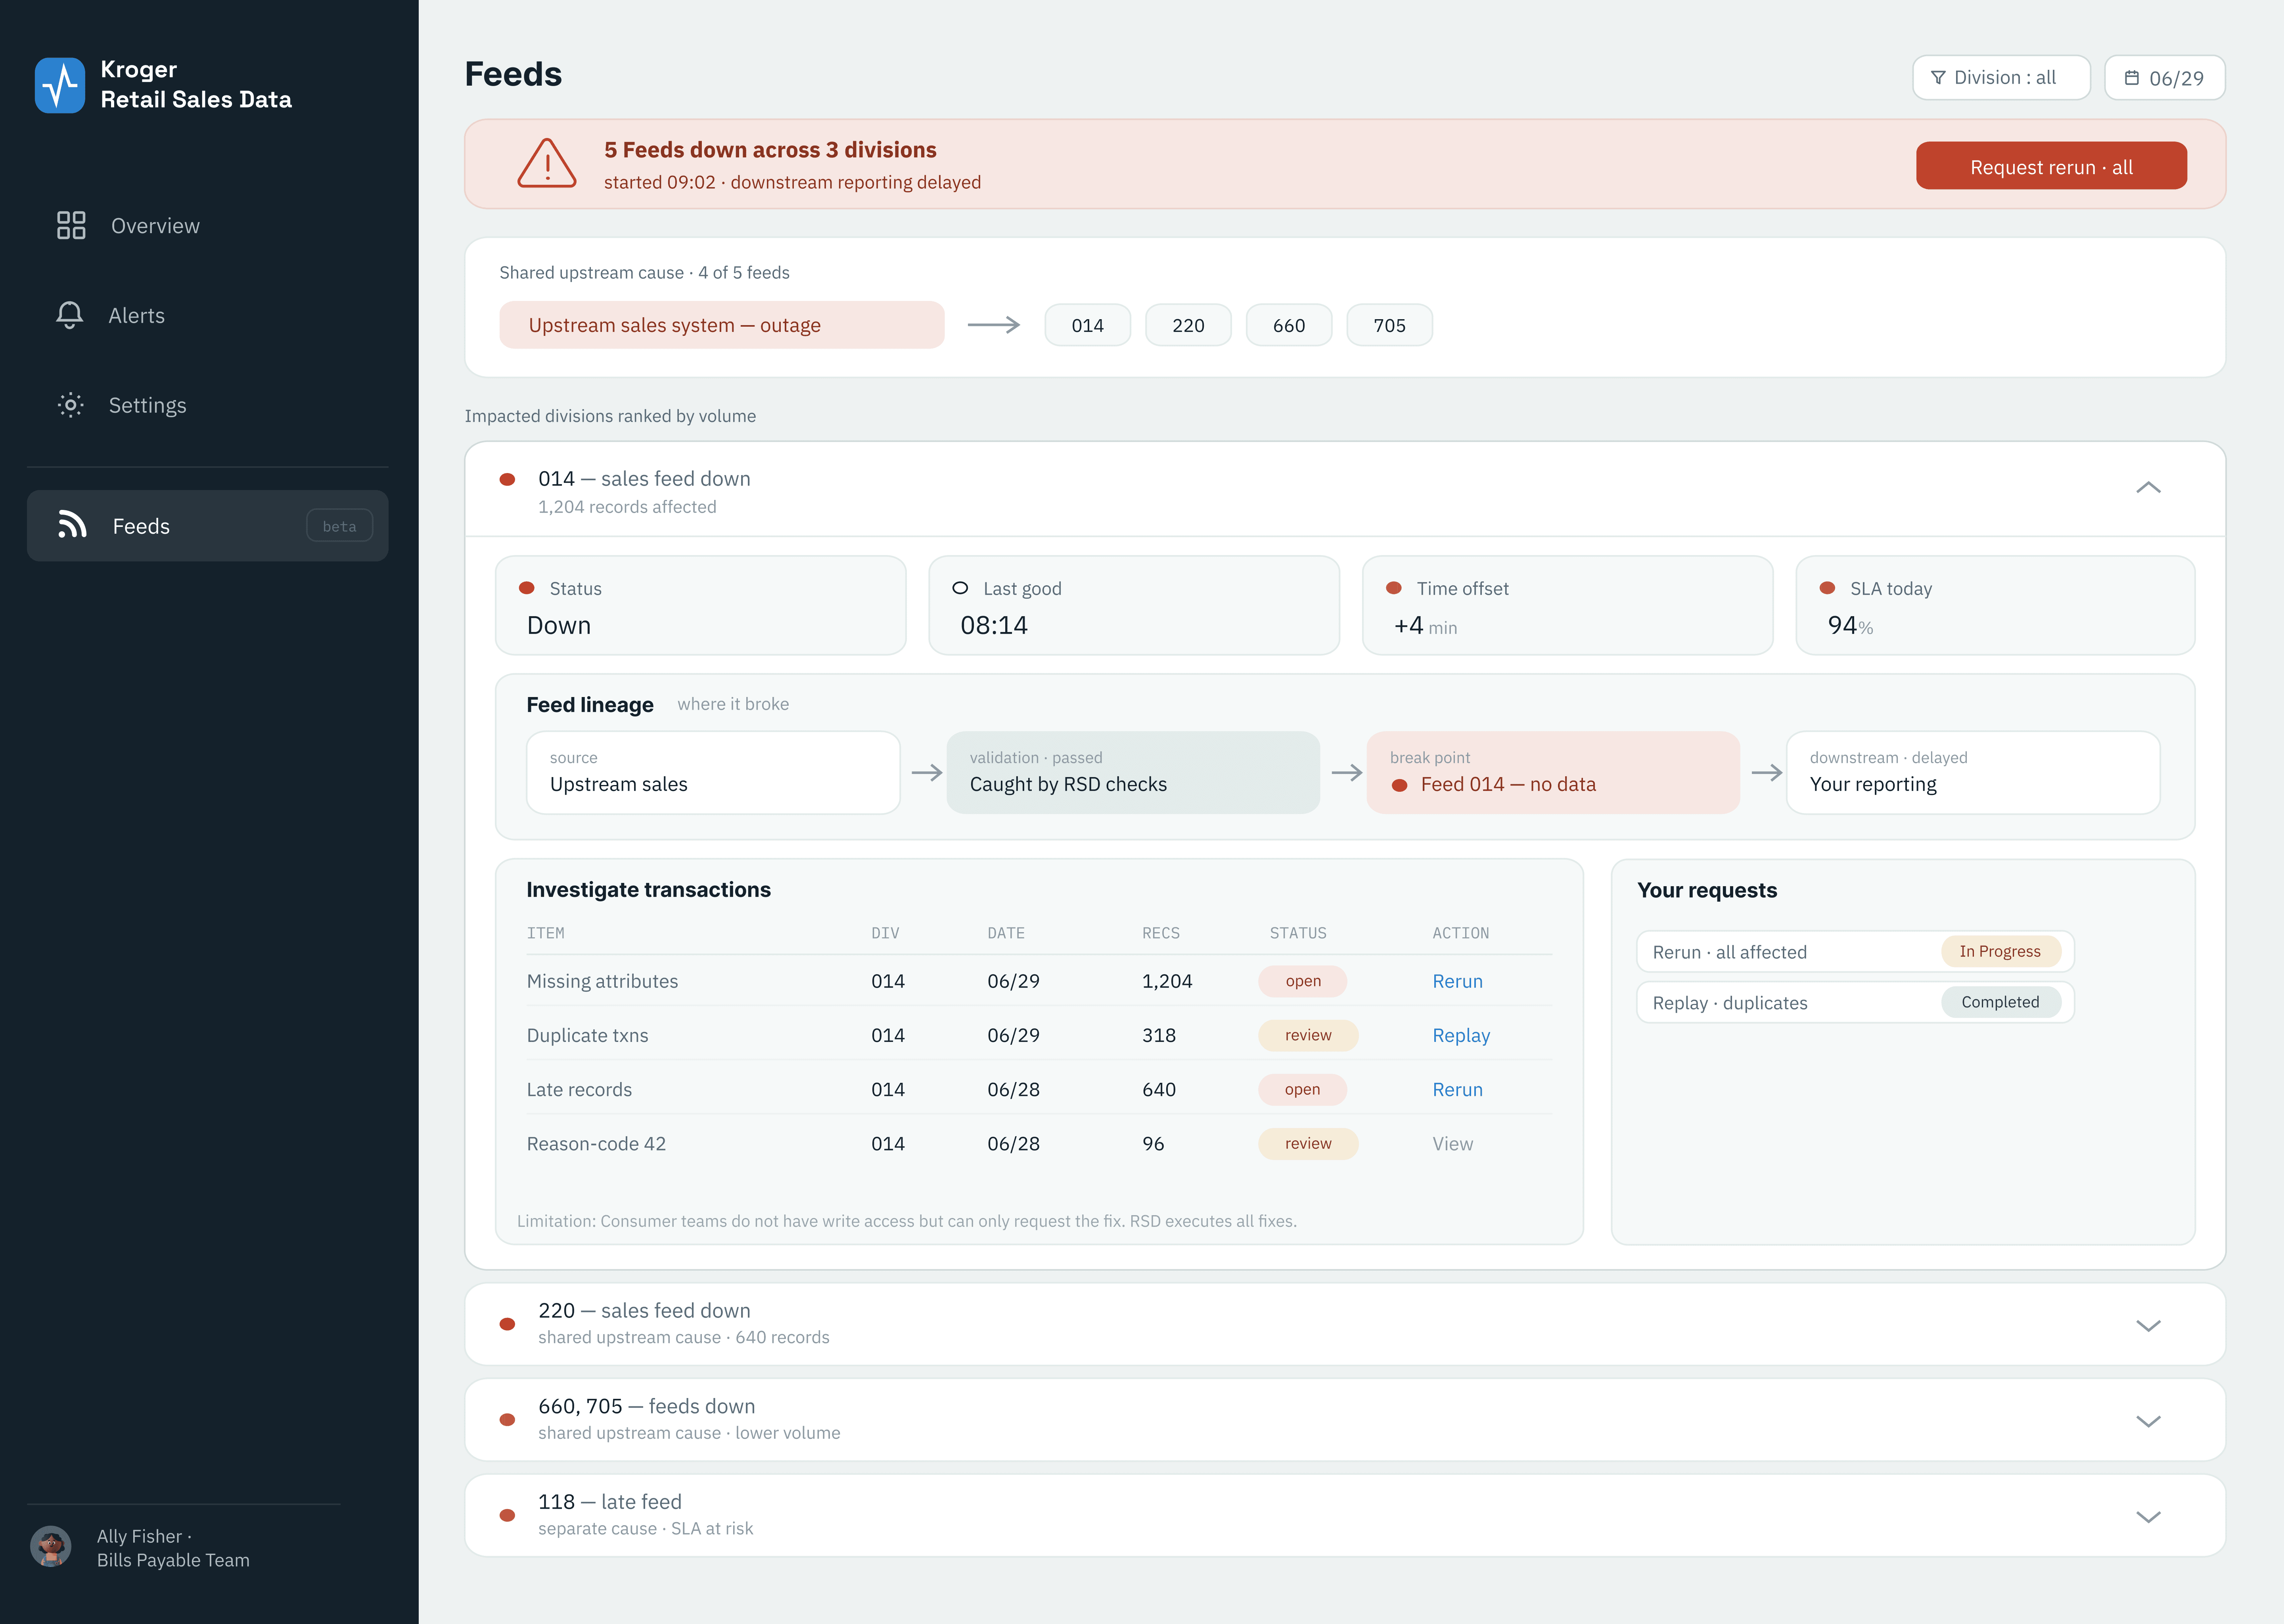
Iteration 02 — Increasing value and visibility with "Feeds" self-querying feature.
Users voiced wanting to be able to search specific data batches independently. While we weren't able to fully release this feature for MVP Phase One due to security measures, we pre-launched a beta version for testing.


Final Solution
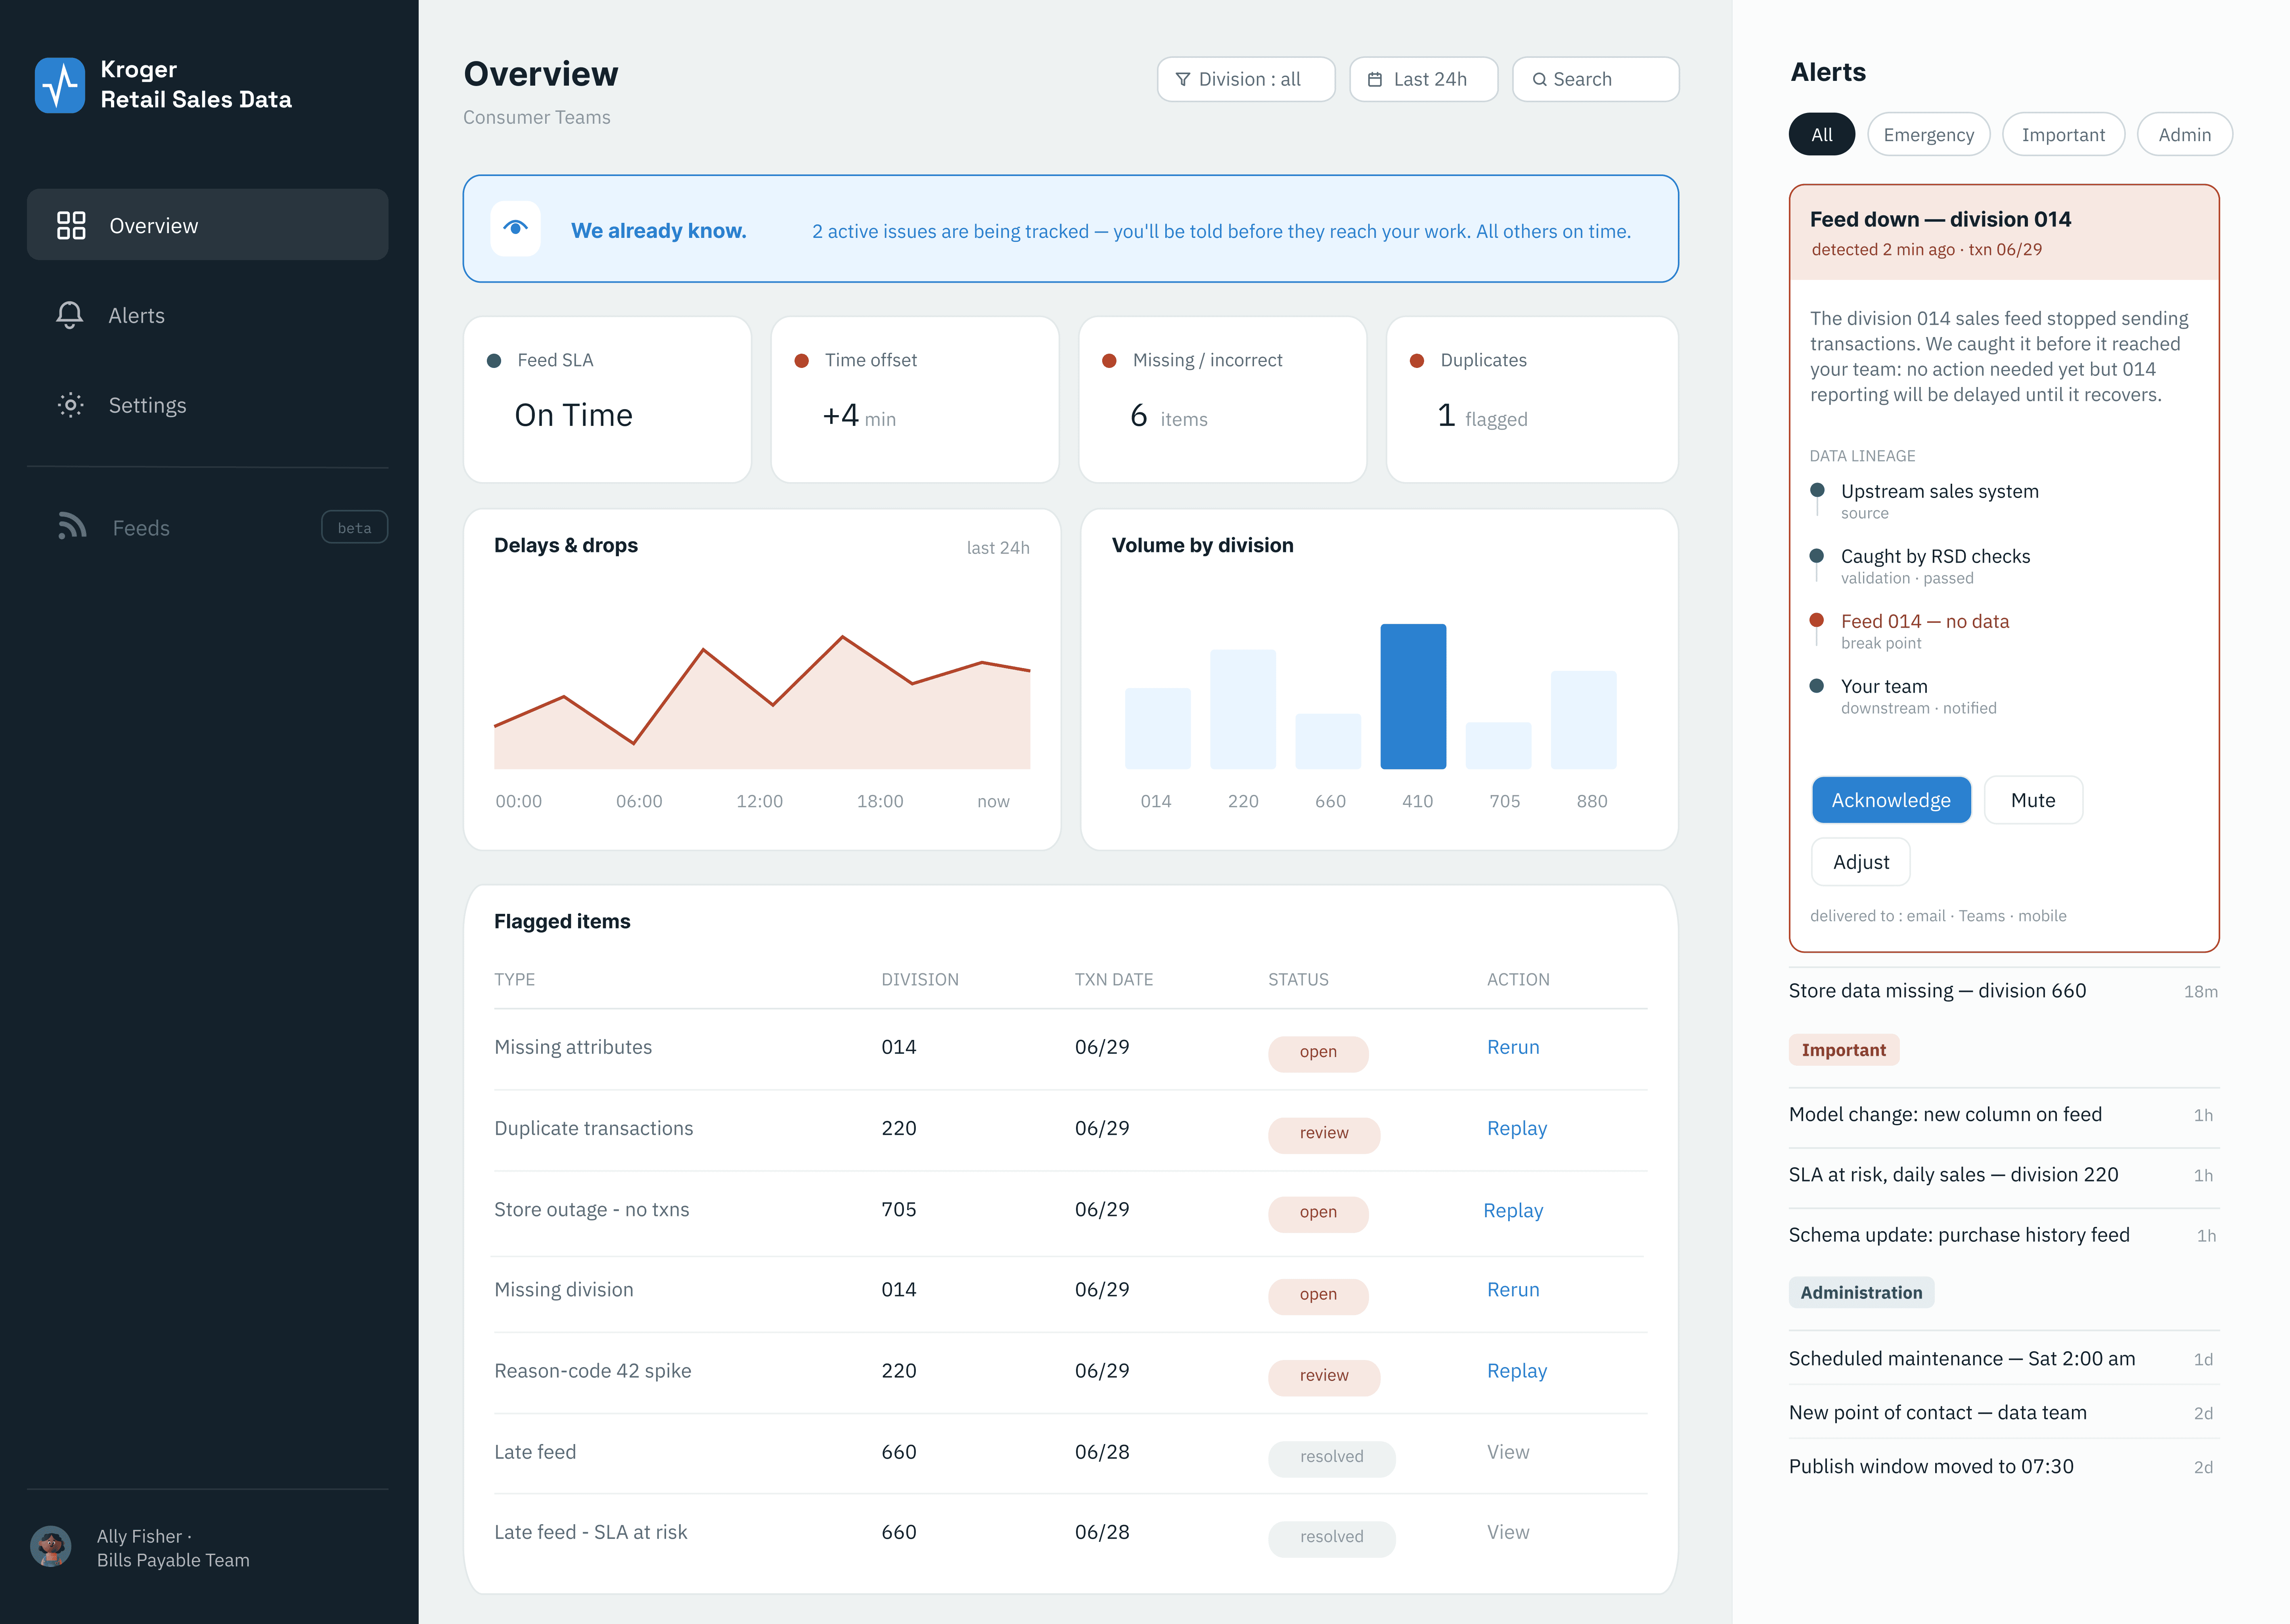
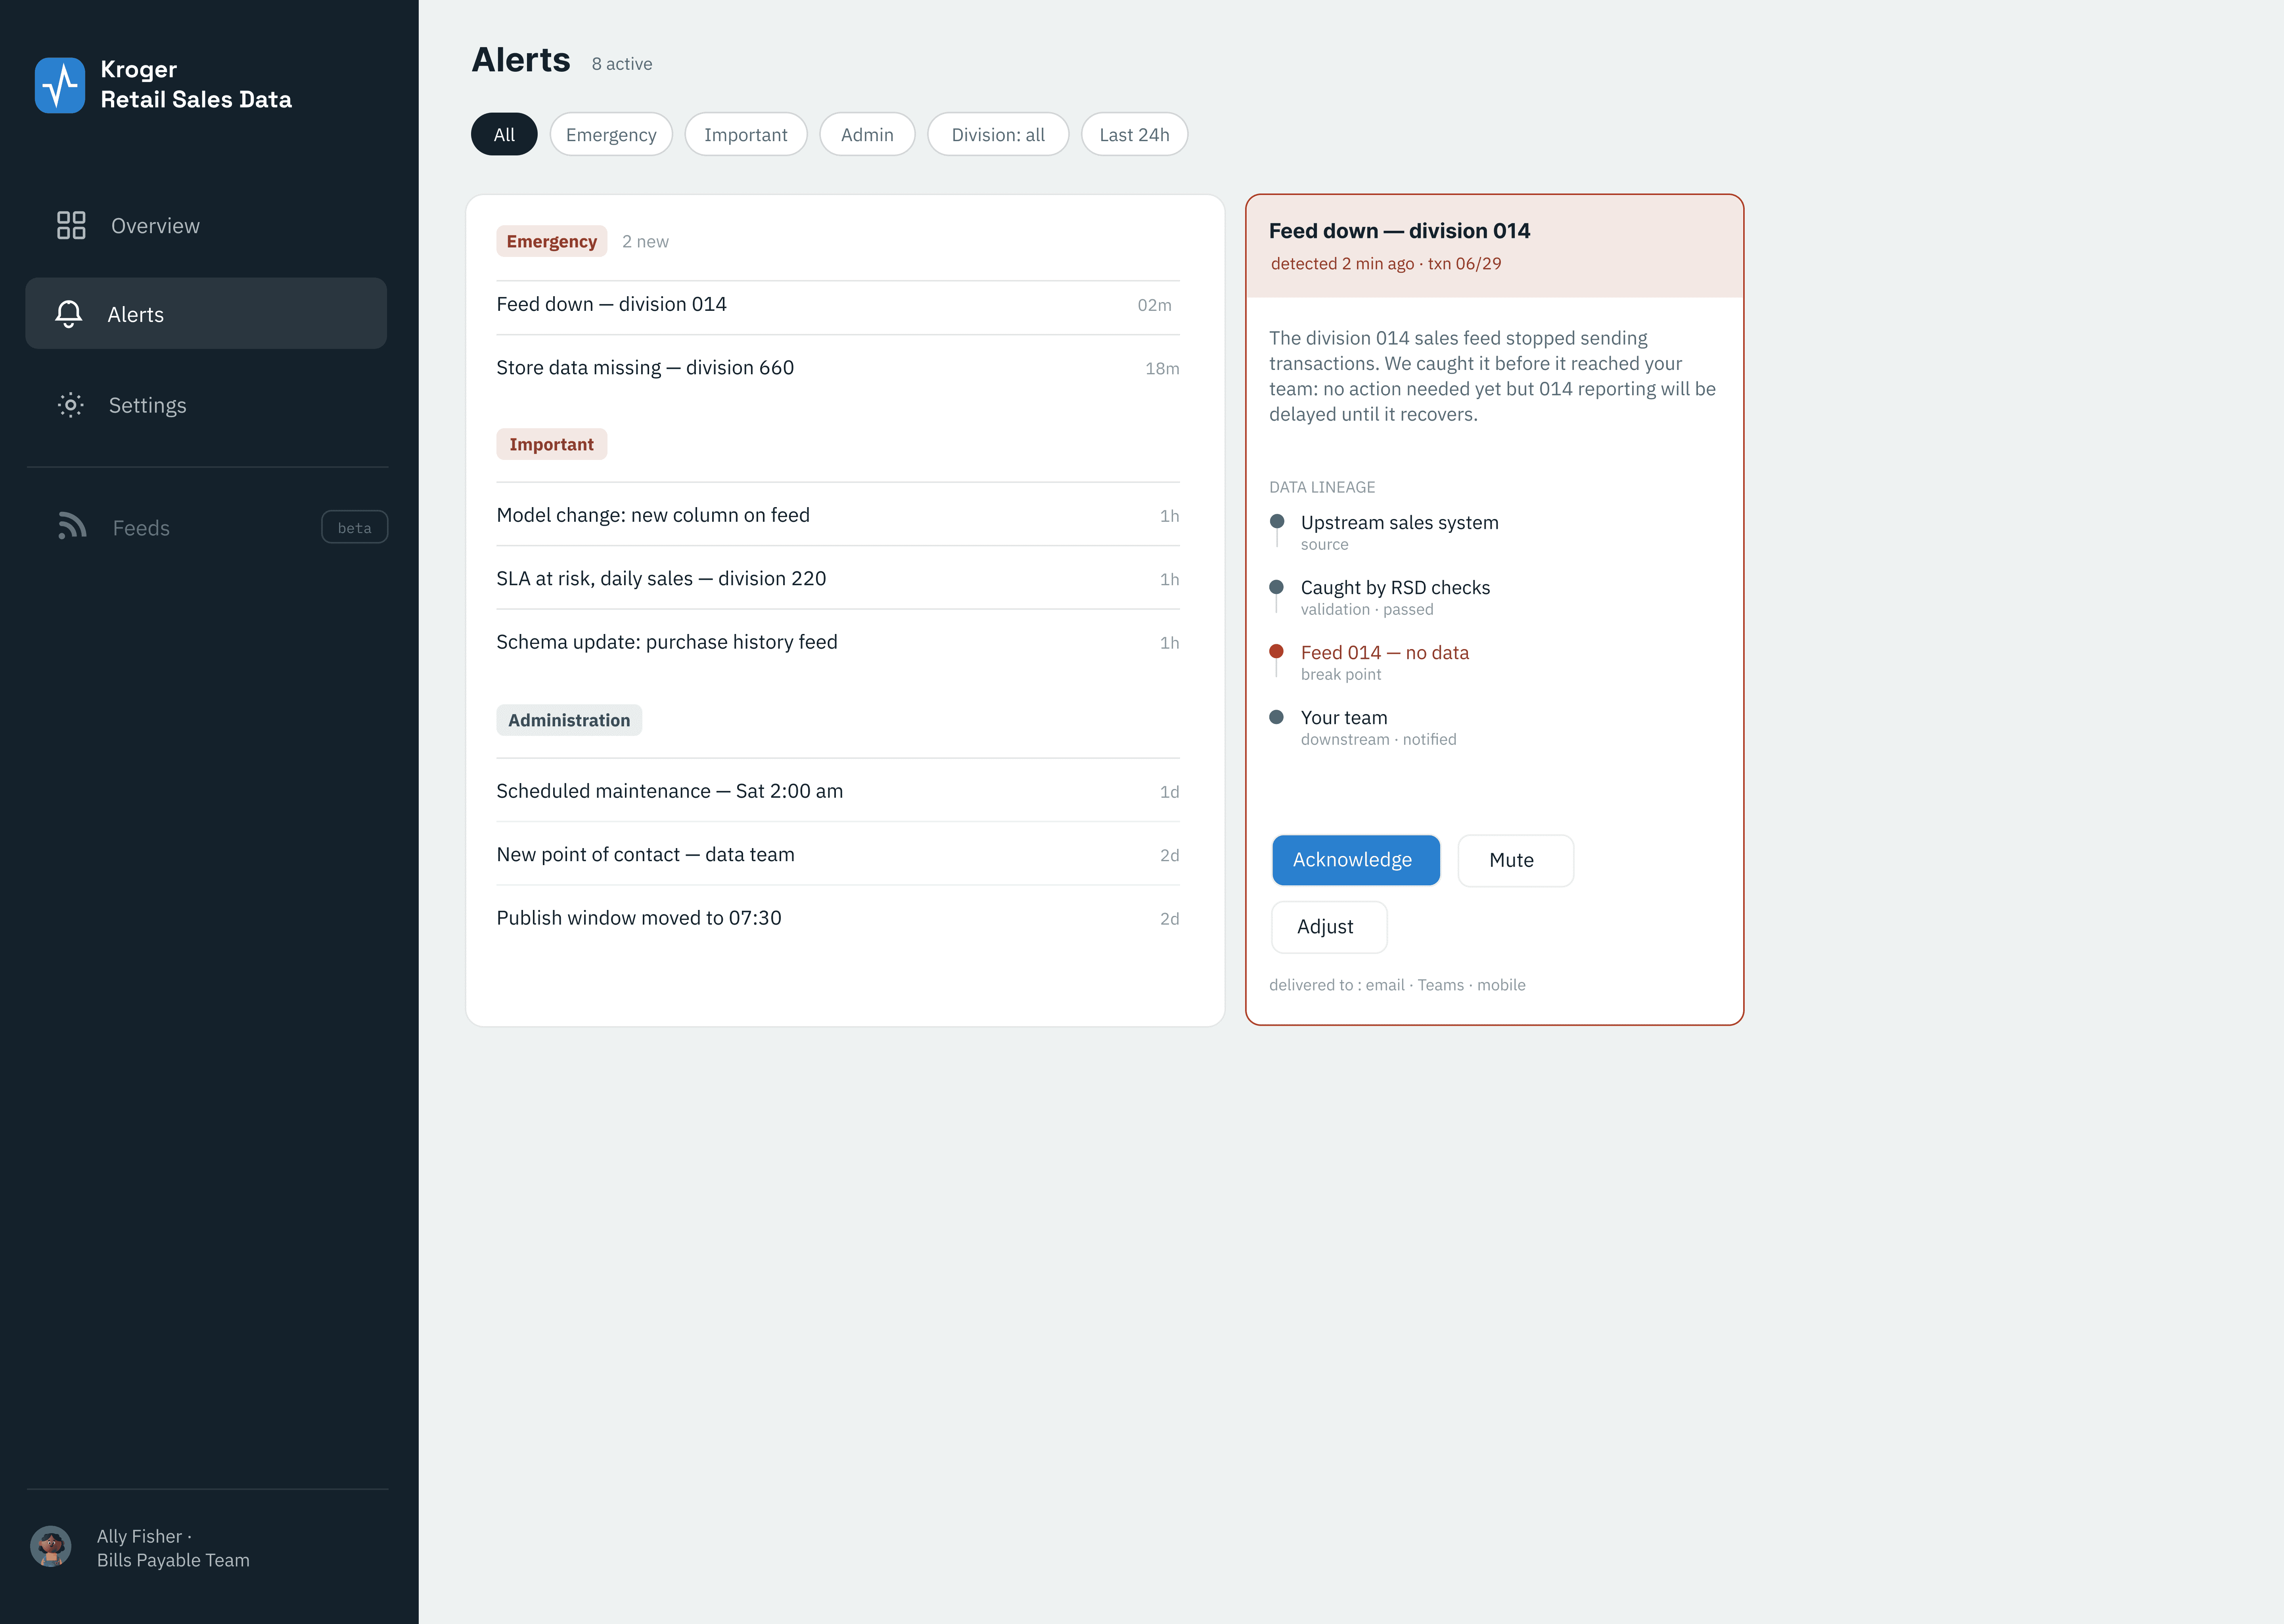
Alerts
The urgency-tiered active/historical issue log informing users what's open, under review, resolved to act or prevent any breakages in real-time.
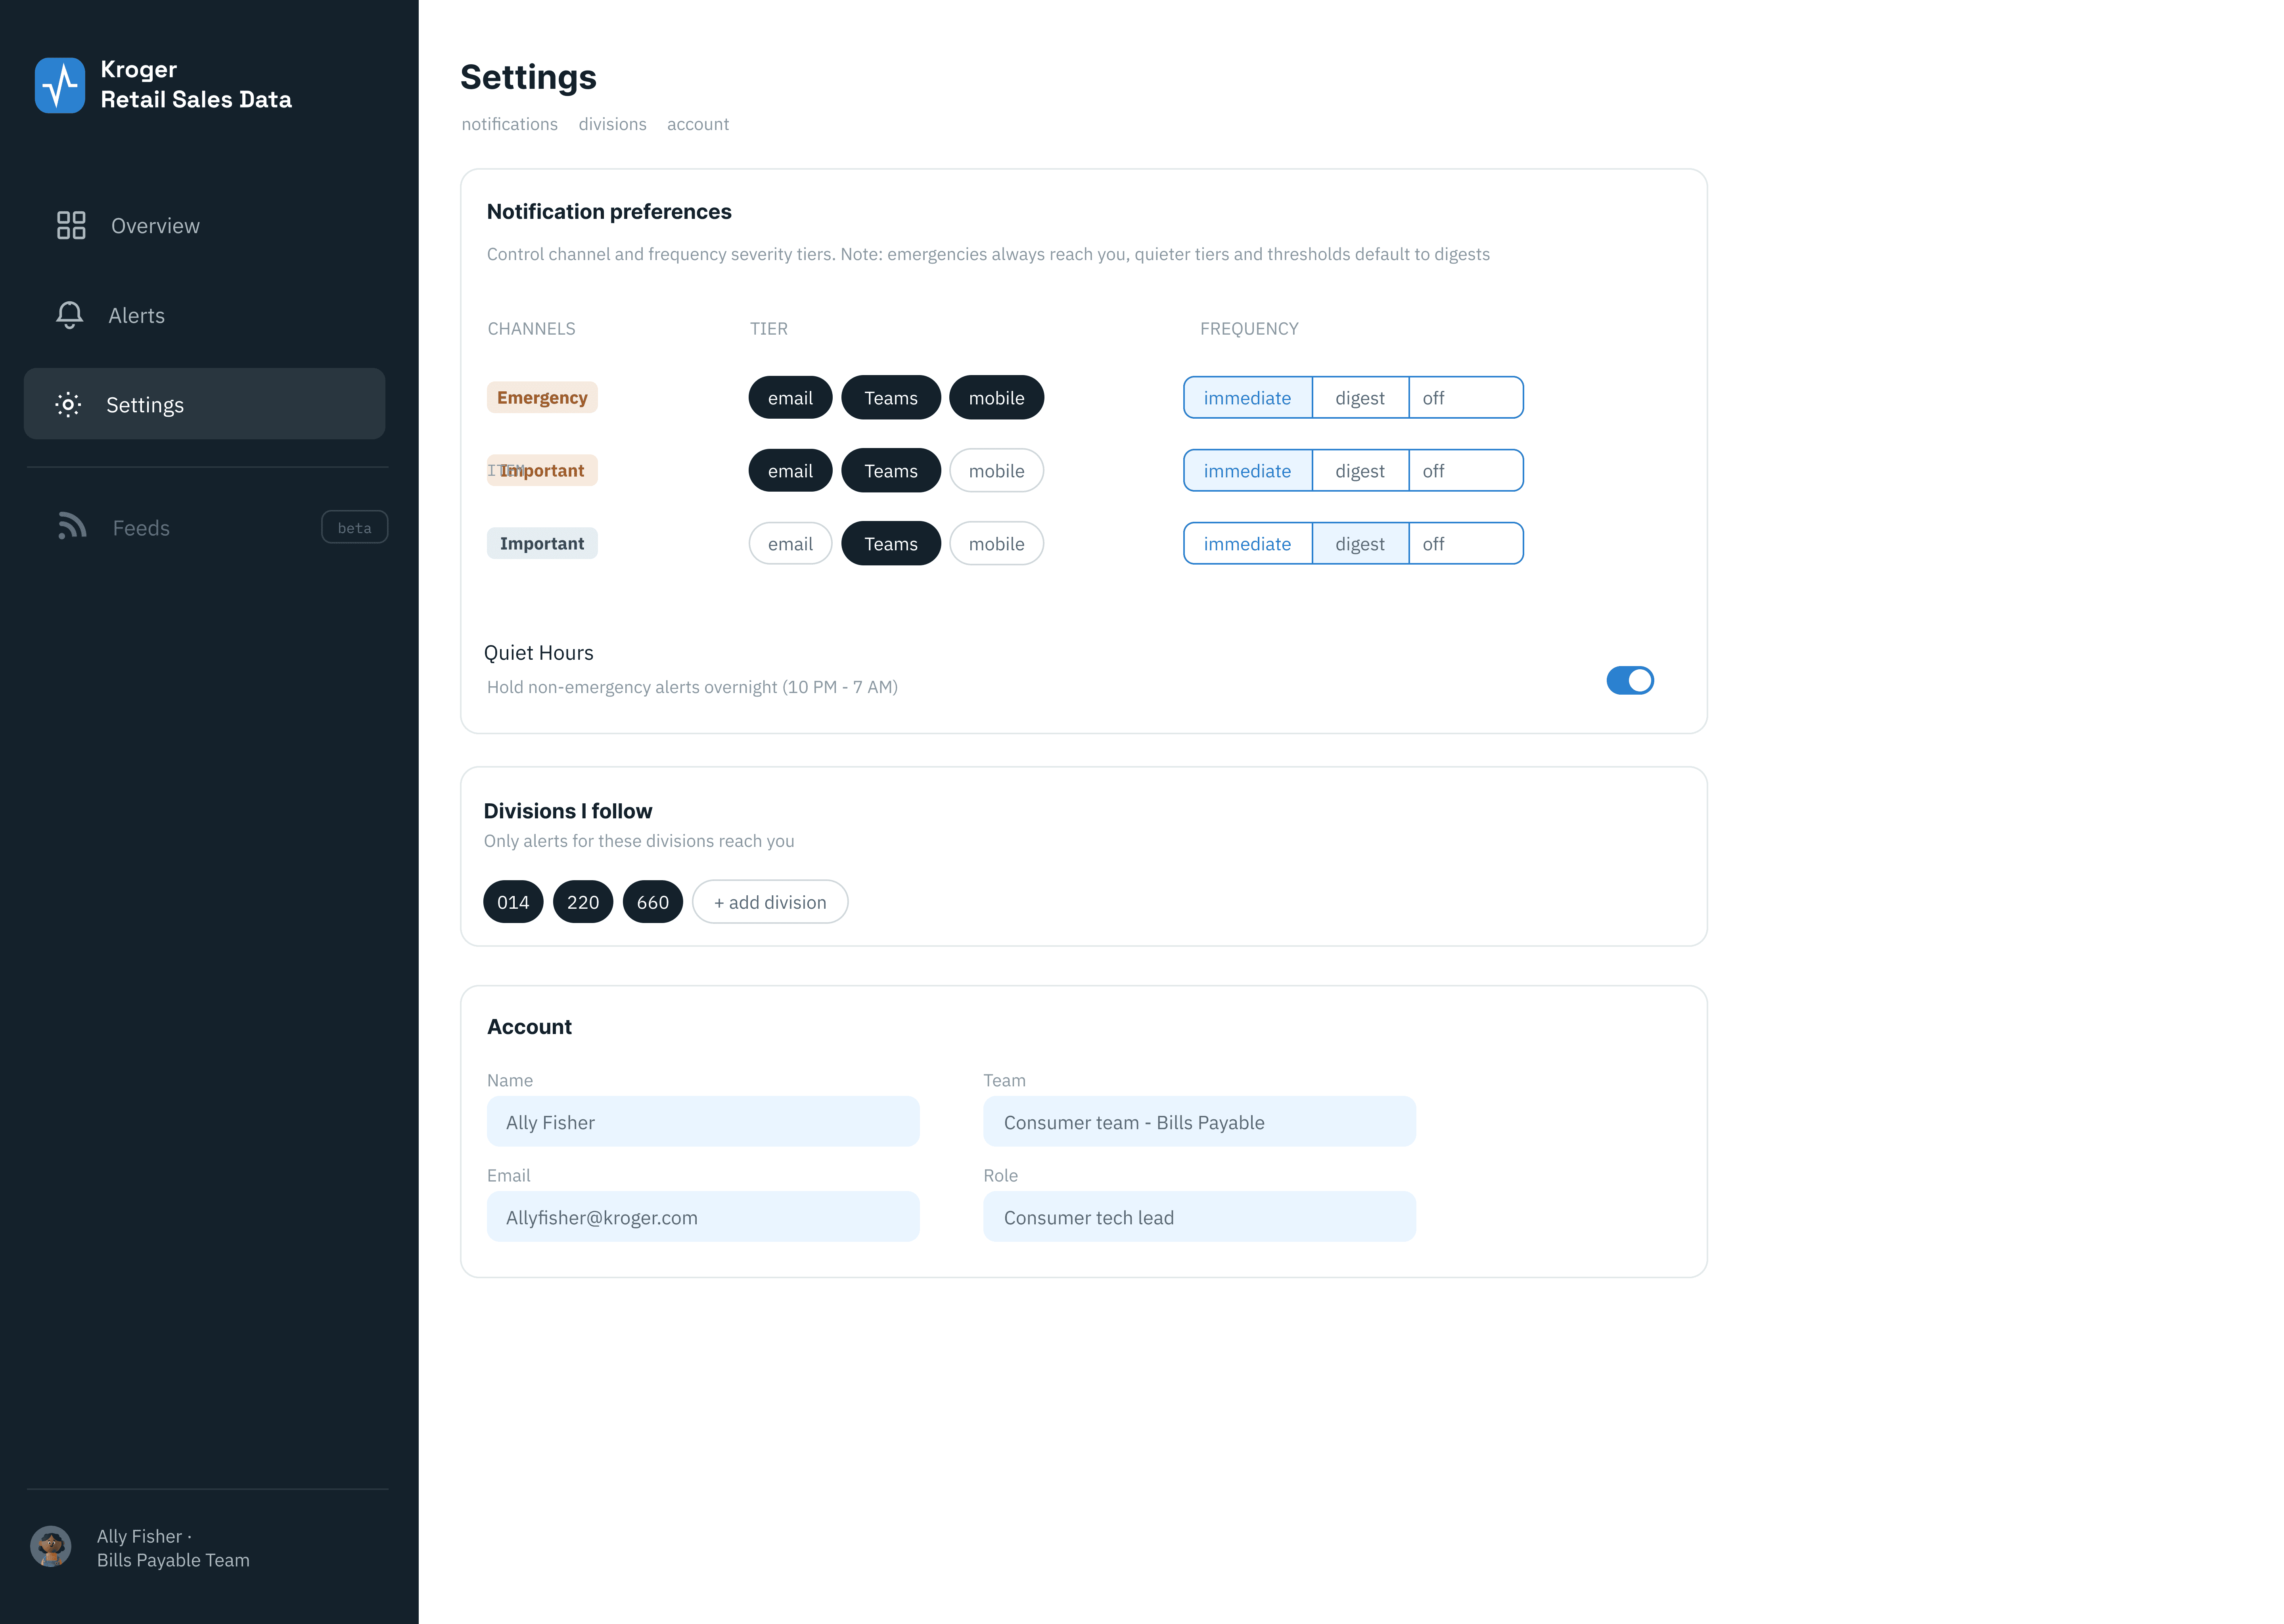
Settings
Houses the account, team, and division scope, and severity-tiered notification preferences for how users want to be communicated.
Feeds (Next Phase)
A self-service drill-down into individual data feeds by division and transaction date (status, SLA, offset, history). Where a tech lead investigates and acts on a specific feed without opening a ticket upstream.
The constant battle of build vs. buy
The third-party engineers pushed for lower integration cost, time, and effort, to ship the proving loop fast creating a disconnection between Design and our users. Building our case to advocate for the user, Design quickly redirected to a custom web app as the crucial communication features were most impactful and feasible to implement.
Pushing back the self-service-drill-down feature (Feeds section)
Our team decided to hold-off on the self-query for launch based on data security and integration effort for. I handed off Phase 1 MVP files for build as well as our Phase 2 designs for further testing in order to keep scaling both business objectives and user goals.
The hardest dependency was organizational, not technical
To inform Sales Data's consumer teams before upstream changes broke their work, I had to think critically through tensions between timeliness and trust and design and technical feasibility. I decided to: (1) tier notifications rather than one undifferentiated stream (2) curated rather than expose every metric (3) design the communication layer accepting upstream teams reliance, in order to drive impact for tech leads and closing the ~6% incident gap goal.
Together these met the primary goal of getting a consumer-facing monitoring and communication solution funded and scoped, the domain's Q4 2024 and Q1 2025 KR.
What I would've done differently
Pushback for continuous discovery testing — A Concierge Pilot Testing to send curated notifications to 1-2 teams, measuring whether tech leads trust and act on them, testing the communication layer and generating real pilot impact data even without or before a launch.
Next steps testing the build
With only six teams an A/B test wouldn't be strong. Instead, I'd derive time-to-awareness from existing ticket timestamps to measure trust and timeliness, then a staggered rollout, onboarding teams in waves to compare onboarded vs. not-yet-onboarded as a quasi-experiment.
I learned vision has to be translated
The third party partners brought in mid-way for build wanted to ship a concrete dashboard, focusing only on configuring data thresholds, while the research pointed to outcomes harder to see on a screen. Defending the vision, I learned ongoing alignment using the roadmap, service blueprint, current and future state journeys, and especially storyboarding as living artifacts was most important.